Case Study
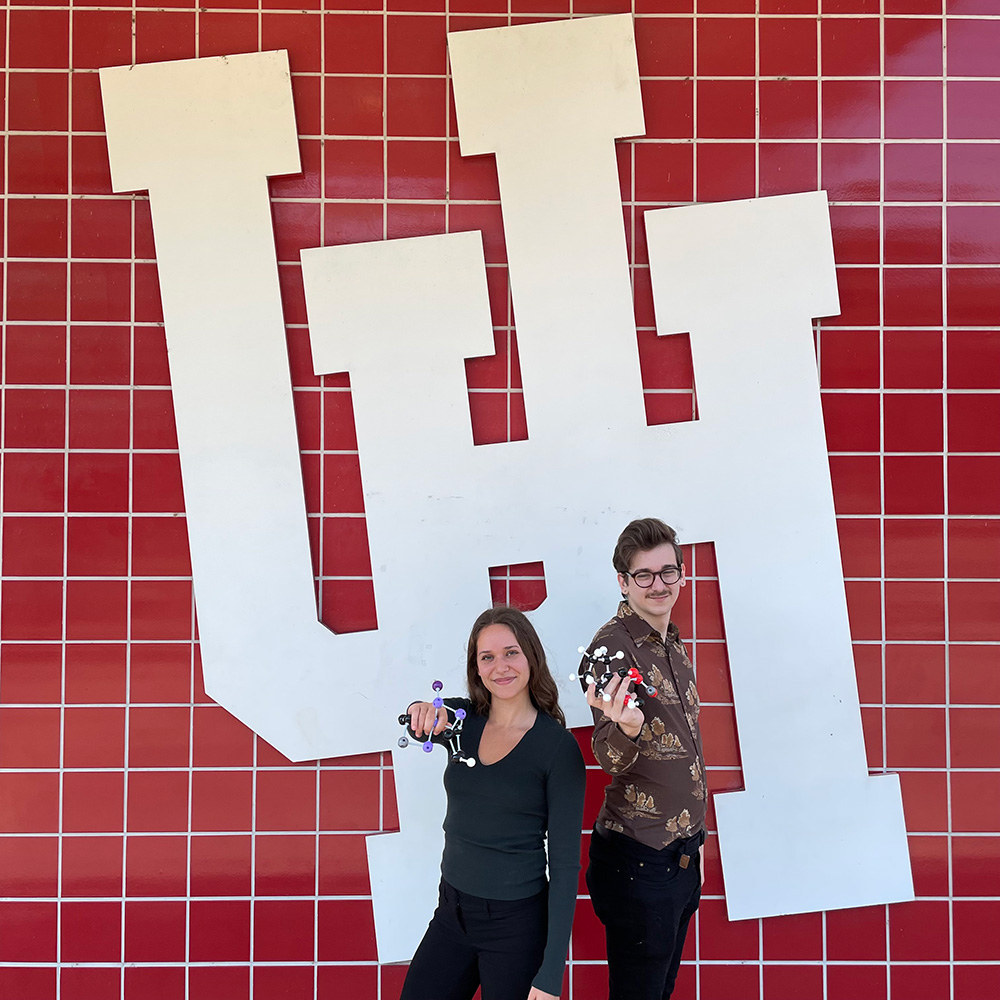
UH's MatLearn Advancing Synthetic Chemistry and Predictions
In a collaborative project, the University of Houston teamed up with LaPraim to create a dynamic public website. This initiative's main goal was to combine advanced machine learning technologies with a user-friendly web interface, enhancing the site's accessibility and functionality.
Explore the site
Integrating Data
Creating Functional Materials Through Data and Experimentation
The primary challenge involved merging data-driven and experimental findings to produce effective non-organic materials. LaPraim's goal centered on crafting a specialized user interface and user experience (UI/UX) design. This was essential for incorporating the innovative machine learning algorithms effectively into a user-friendly web application.
Innovative Machine Learning
Leveraging Flask and Python for Advanced Web Development
During the project's development, the team utilized a suite of technologies including Flask, Python, scikit-learn, and Matplotlib. Matplotlib was primarily chosen for its efficient charting capabilities, while scikit-learn played a key role in incorporating machine learning data into these charts. Flask, a micro-framework for Python, was selected for its simplicity, eliminating the need for extra tools. To enhance interactivity and presentation, CSS, HTML, and JavaScript were employed. Additionally, the team opted for a modern hosting solution like AWS, streamlining user experience and simplifying maintenance.
Transforming Material Analysis
MatLearn Revolutionizing Material Formation Predictions
MatLearn Guiding Solid State Synthesis
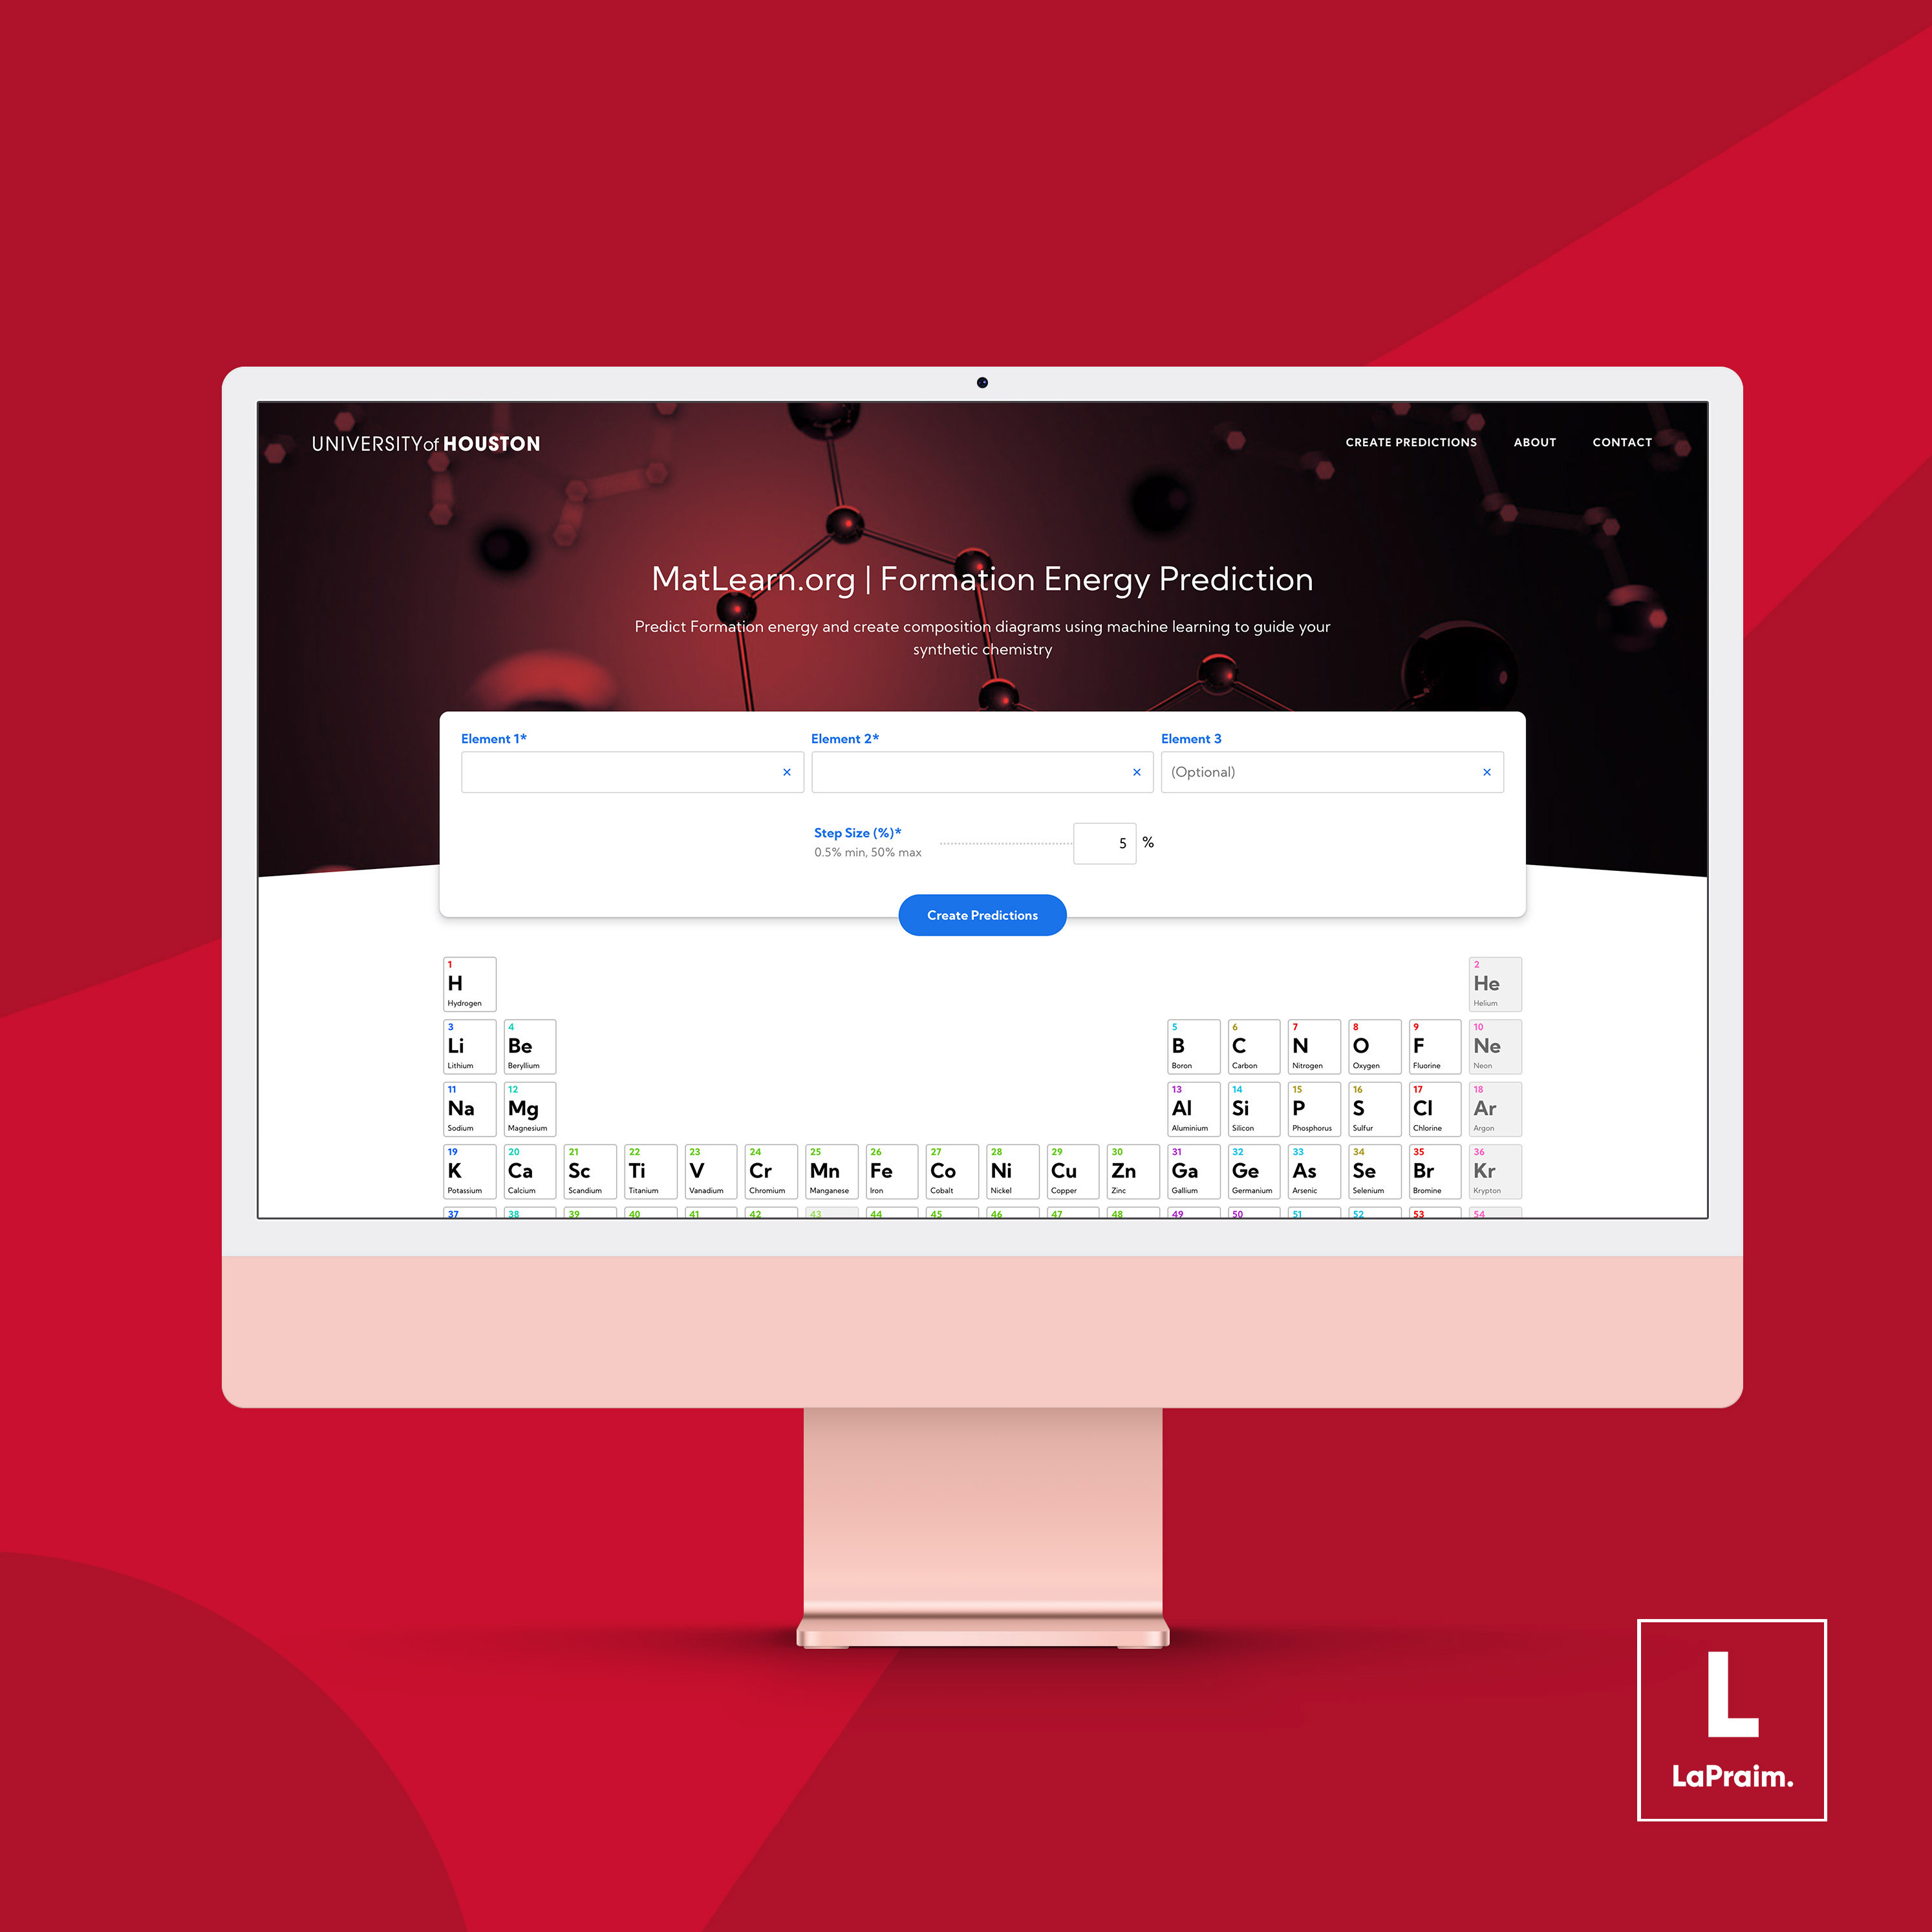
MatLearn is designed to facilitate the prediction of material formations, utilizing its integrated machine learning capabilities for creating and experimenting with synthetic chemistry diagrams. It serves as an efficient tool for exploring a vast array of material properties, especially in compositional spaces. This web-based platform aids in directing solid-state synthetic processes towards specific areas of a diagram, allowing users to concentrate on compounds with optimal characteristics.
MatLearn operates by blending ternary and binary systems, presented on its homepage, enabling users to determine suitable composition ranges for prediction. It generates immediate diagrams for these systems. For binary systems, MatLearn’s estimations are indicated by a blue dot, with gray shading denoting prediction accuracy. Vertical lines represent compounds from training data. This system simplifies the process of generating precise predictions and analyzing data with ease.
Our Work
Related Case Studies
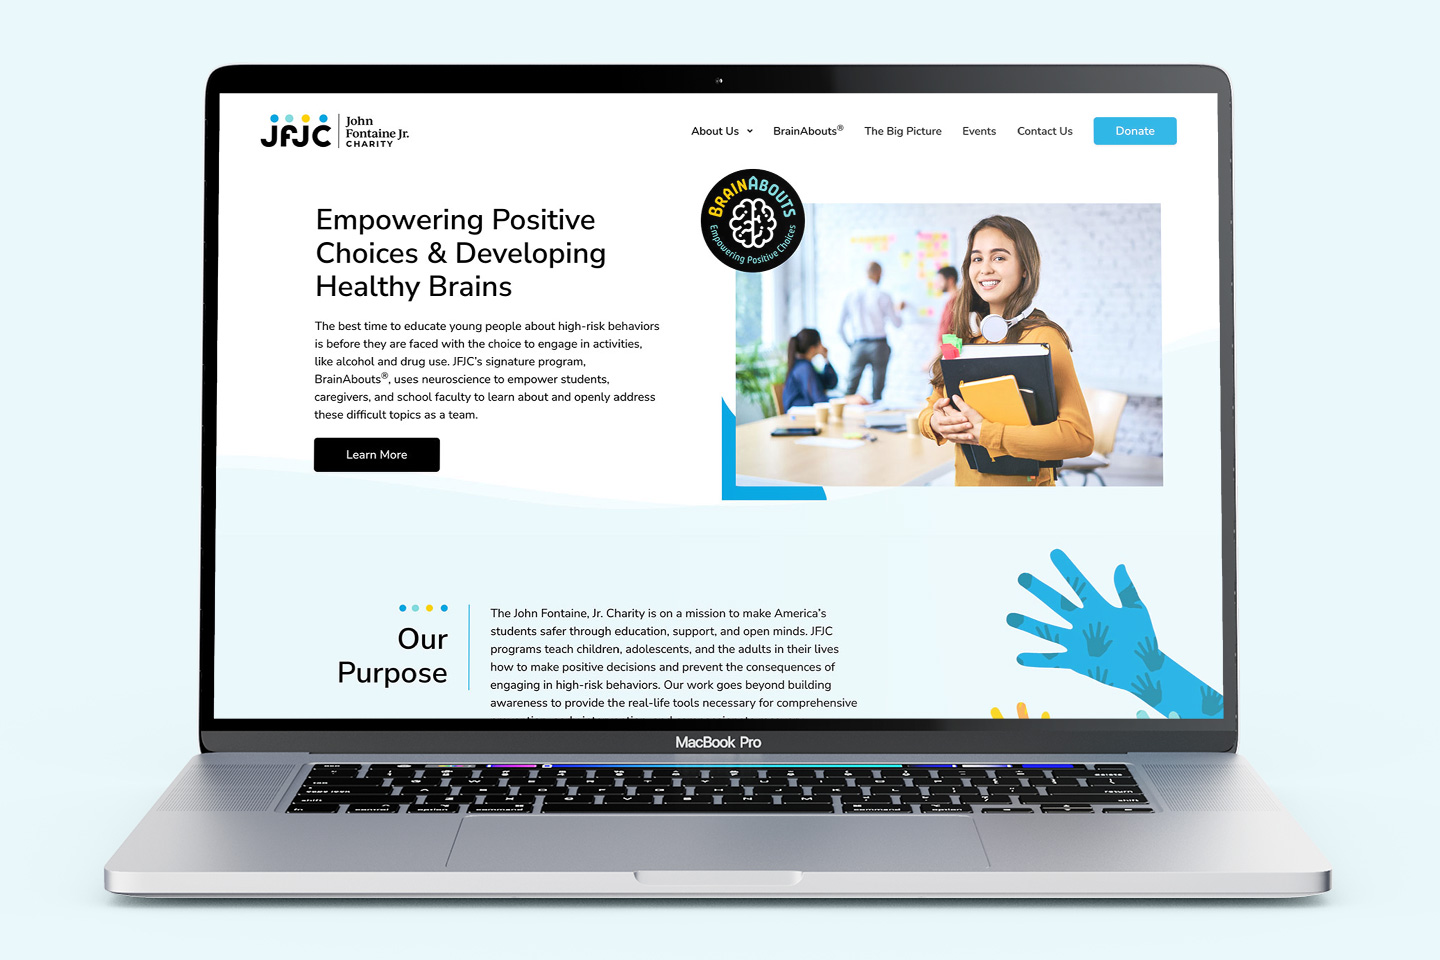
John Fontaine, Jr. Charity
Learn how JFJC's website is shaping the future of youth empowerment. Witness the impact of their BrainAbouts program and digital excellence with WordPress and WP Engine.
Visit case study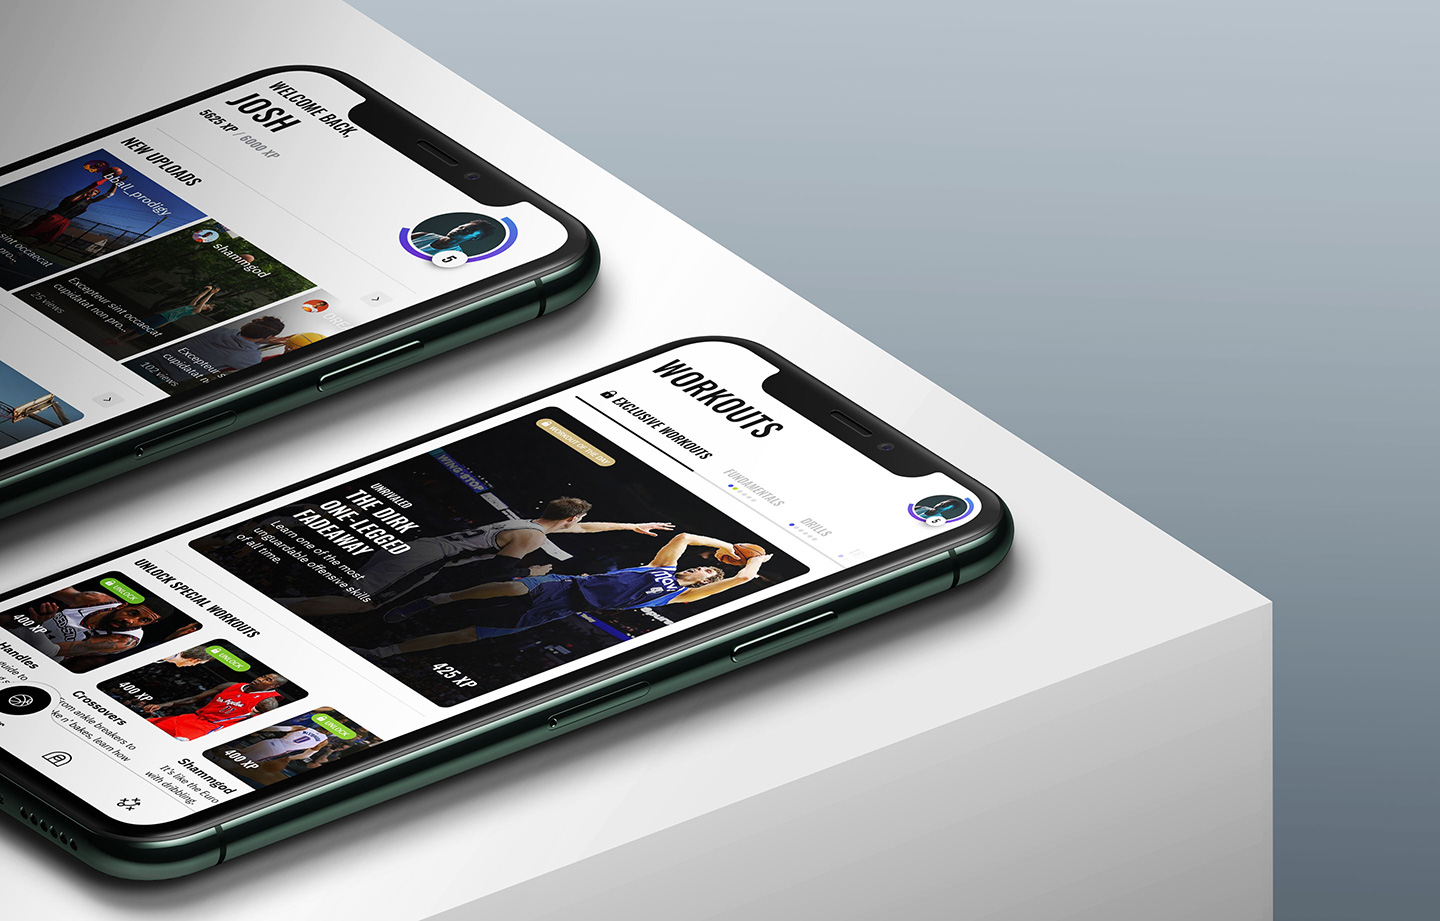
Hoopstars
Discover Hoopstars by Six Zero Athletes' founder, Brandon Roberson, where cutting-edge technology and UI/UX expertise transform sports coaching into a seamless cross-platform experience.
Visit case study
DirSec
In the evolving digital realm, DirSec revamped its website with strategic SEO, funnel campaigns, and WordPress integration, reinforcing its position as a leading secure IT solutions expert.
Visit case studyConnect in 3 simple steps
Let's connect.
We want to hear from you and learn how we can make technology work for your organization.